Analytics
Review ti-ny.link visits, referrers and audience context. Learn to compare placements, use UTM parameters and interpret missing data.
Last reviewed:
Start with the question you want to answer
ti-ny.link Analytics helps you review activity on your links. Use it to compare placements, understand available referral information and decide where to focus your next campaign.
The built-in link statistics are processed within ti-ny.link and stored in its application database. The marketing website uses Google Analytics, separately from the built-in link reports. For data retention and deletion details, read the Privacy Policy.
For a product overview, explore Analytics.
Review an individual link
- Open a link’s statistics icon from its settings or link list. For an account-wide view, use Links statistics in the sidebar.
- Select the date range relevant to your campaign.
- Review Pageviews and Visitors in Overview, then use the report tabs to inspect available source and audience information.
- Allow time for new activity to appear. If a chart is empty, check the date range and the individual link’s statistics again.
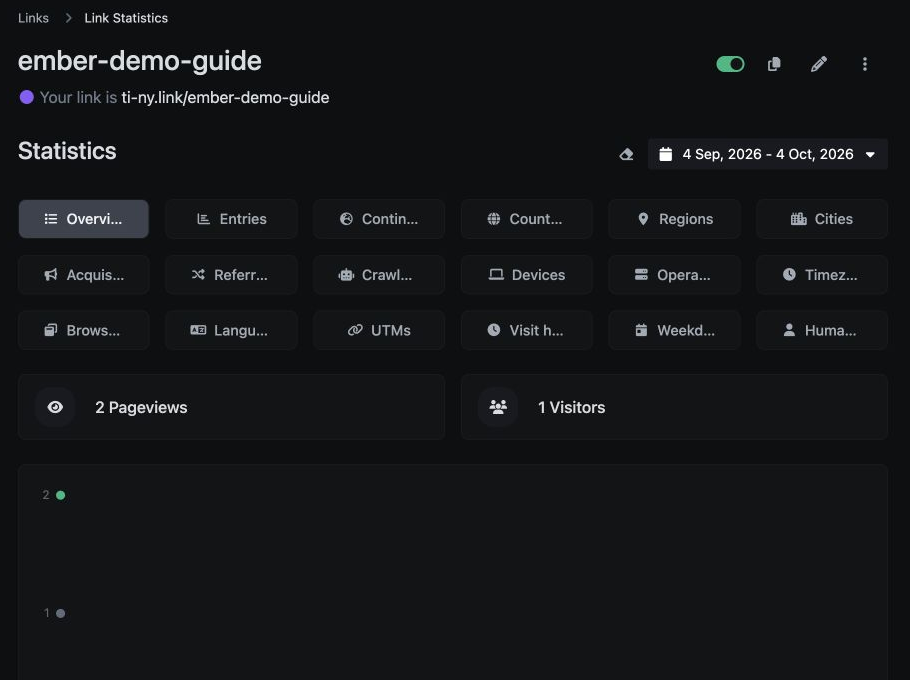
The statistics interface includes Entries, geographic reports, Acquisition channels, Referrers, Crawlers, Devices, Operating systems, Timezones, Browsers, Languages, UTMs, Visit hours, Weekdays and Human vs crawlers. The information recorded depends on the visitor’s environment and your plan.
Inspect referrers
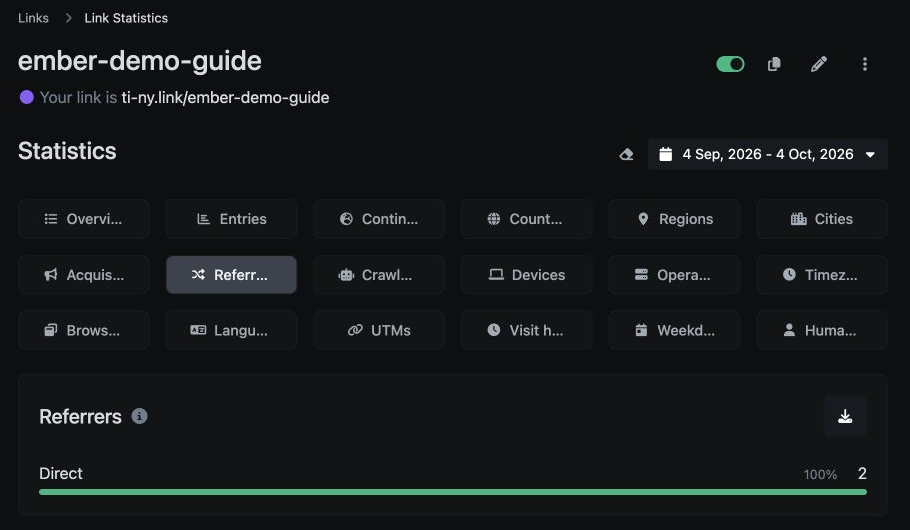
Open Referrers to inspect the available source information for the selected period. Direct or missing referrers do not reveal exactly how someone found the link: browsers, apps and privacy settings affect what is sent.
Review device context
Open Devices to review the available device information, then check your destination on the devices that matter to your audience. Statistics describe recorded activity; they do not establish that someone completed a purchase or signup.
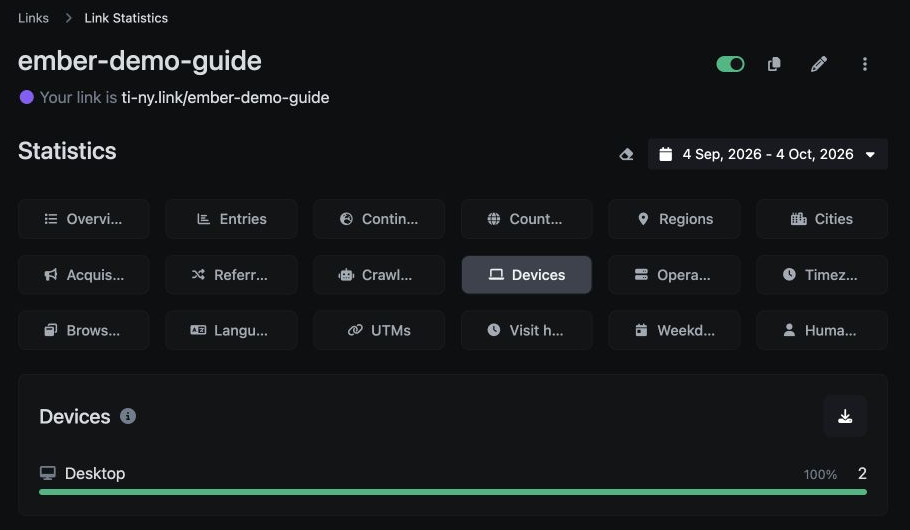
Screenshots show sample activity from a demo link.
Compare campaign placements
Create distinct short links for an email, social profile and printed poster. Give each a clear name and compare their statistics over the same period.
For a QR campaign, connect each placement’s code to its own short link. Sharing one link across several channels makes those channels harder to distinguish. See the editable QR campaign guide for a practical example.
Use consistent UTM parameters on your destinations when you also measure campaigns in a destination analytics tool. Check the redirected URL after saving. These fields append values to the outgoing destination URL. Use your destination analytics to read these campaign values, and check the values recorded in ti-ny.link’s UTMs report separately. Measure purchases and signups at the destination.
Interpret the limits of link statistics
| Observation | How to read it |
|---|---|
| A missing referrer | Apps, browsers and privacy settings can omit referral information. Direct and unknown sources are normal. |
| Recorded visits | A visit is activity on a link, not confirmation that a person completed a download, opened an app or made a purchase. |
| QR-link activity | It can include any visit to the encoded short link. A camera scan that never opens the URL is not the same as a recorded visit. |
| Location and device context | Treat the available information as context, not a complete or precise profile of each visitor. |
| Different totals across tools | Tools can observe different parts of the journey and use different counting methods. Compare like-for-like periods and events. |
If you need to measure an outcome on your shop, booking page or other destination, configure that measurement there. An available tracking-pixel integration may support your workflow, but events must still be set up and checked with the provider.
Check available statistics history
Free includes 1 month of statistics history. Paid plans include longer periods. Compare statistics history by plan to choose a reporting window that covers your campaign. These are reporting-history allowances; the Privacy Policy explains account-data retention and deletion.