
Link analytics. See what connects.
Explore the activity behind your links and QR codes. See visits, referrers and available audience context to understand what is working.
Get started free ↗Read the link-analytics guide →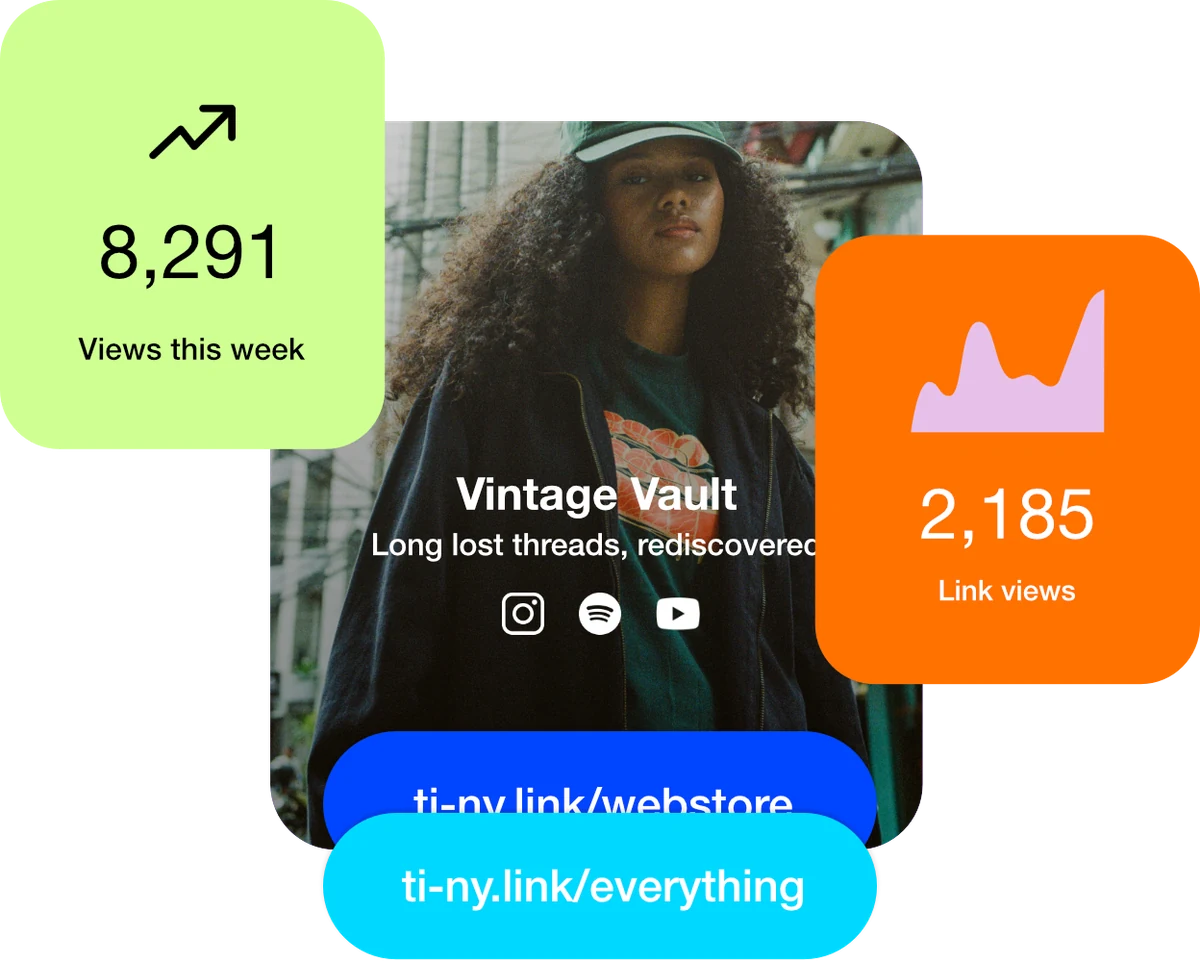
Turn activity into your next move.
Look at individual links
Open a link’s statistics to inspect its activity. A focused view helps you understand one shared destination at a time.
Explore referrers
See available referral information for visits. Privacy settings, apps and browsers may limit the data reported.
Add campaign context
Use clear UTM values on your destination and a consistent naming approach across campaigns. Check those values after redirects.
Start with a question, not a dashboard.
Want to know which shared link is bringing people in? Create distinct links for distinct placements, check their statistics and compare within the same time window. Allow time for data to appear.
Start with something simple.
- Create and name links for your placements.
- Share them and open each link’s statistics.
- Review visits and available source information.
SEE HOW IT WORKS
Turn link activity into useful context.
Review activity over a chosen period, then explore the available source and device context. Compare like-for-like date ranges when reviewing placements.
Choose the report and date range
Open Links statistics for an overview, or an individual link’s statistics for a closer look. Select the period you want to review and check the dates if a chart is empty.
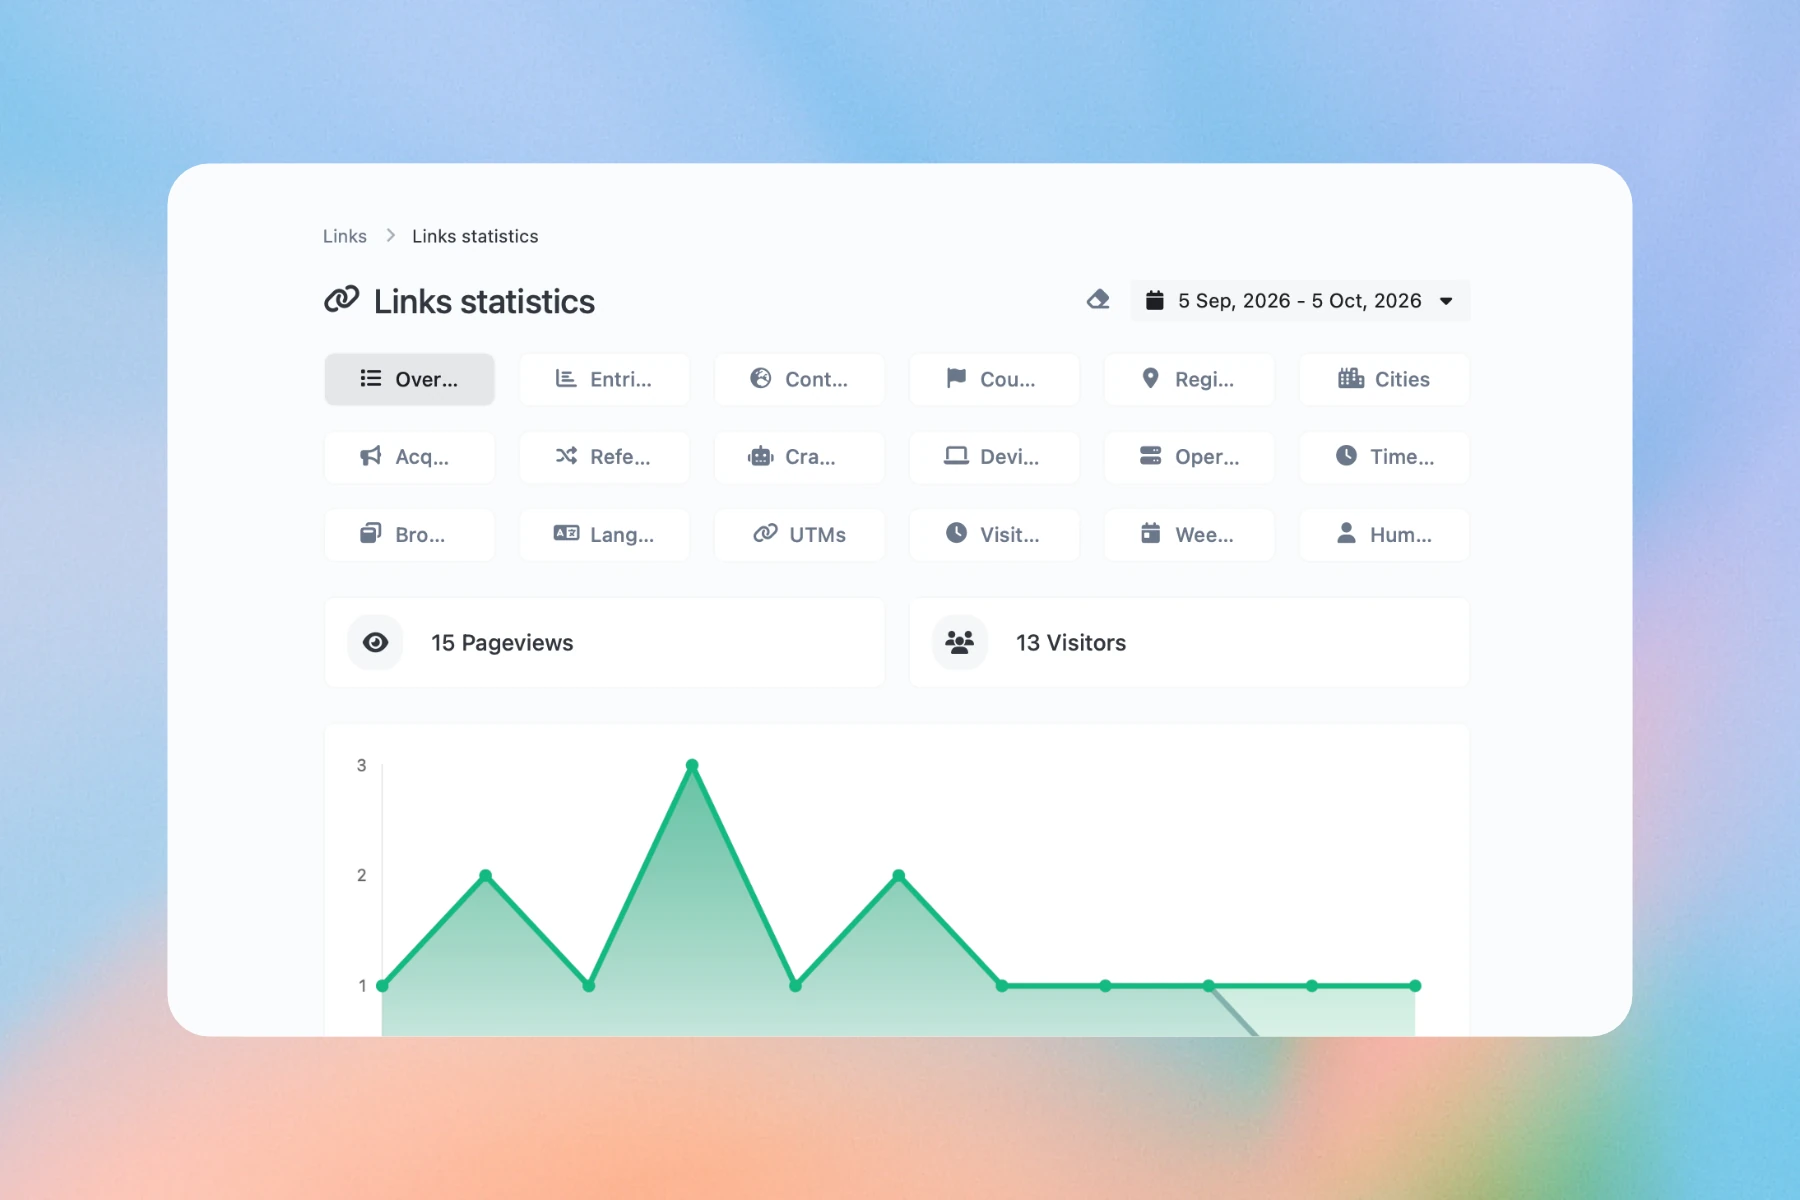
An example overview shows 15 pageviews and 13 visitors for the selected date range. Inspect the available referrers
Review source information where it is available. A missing referrer does not establish how a visitor found you; apps, privacy settings and direct visits can all affect it.
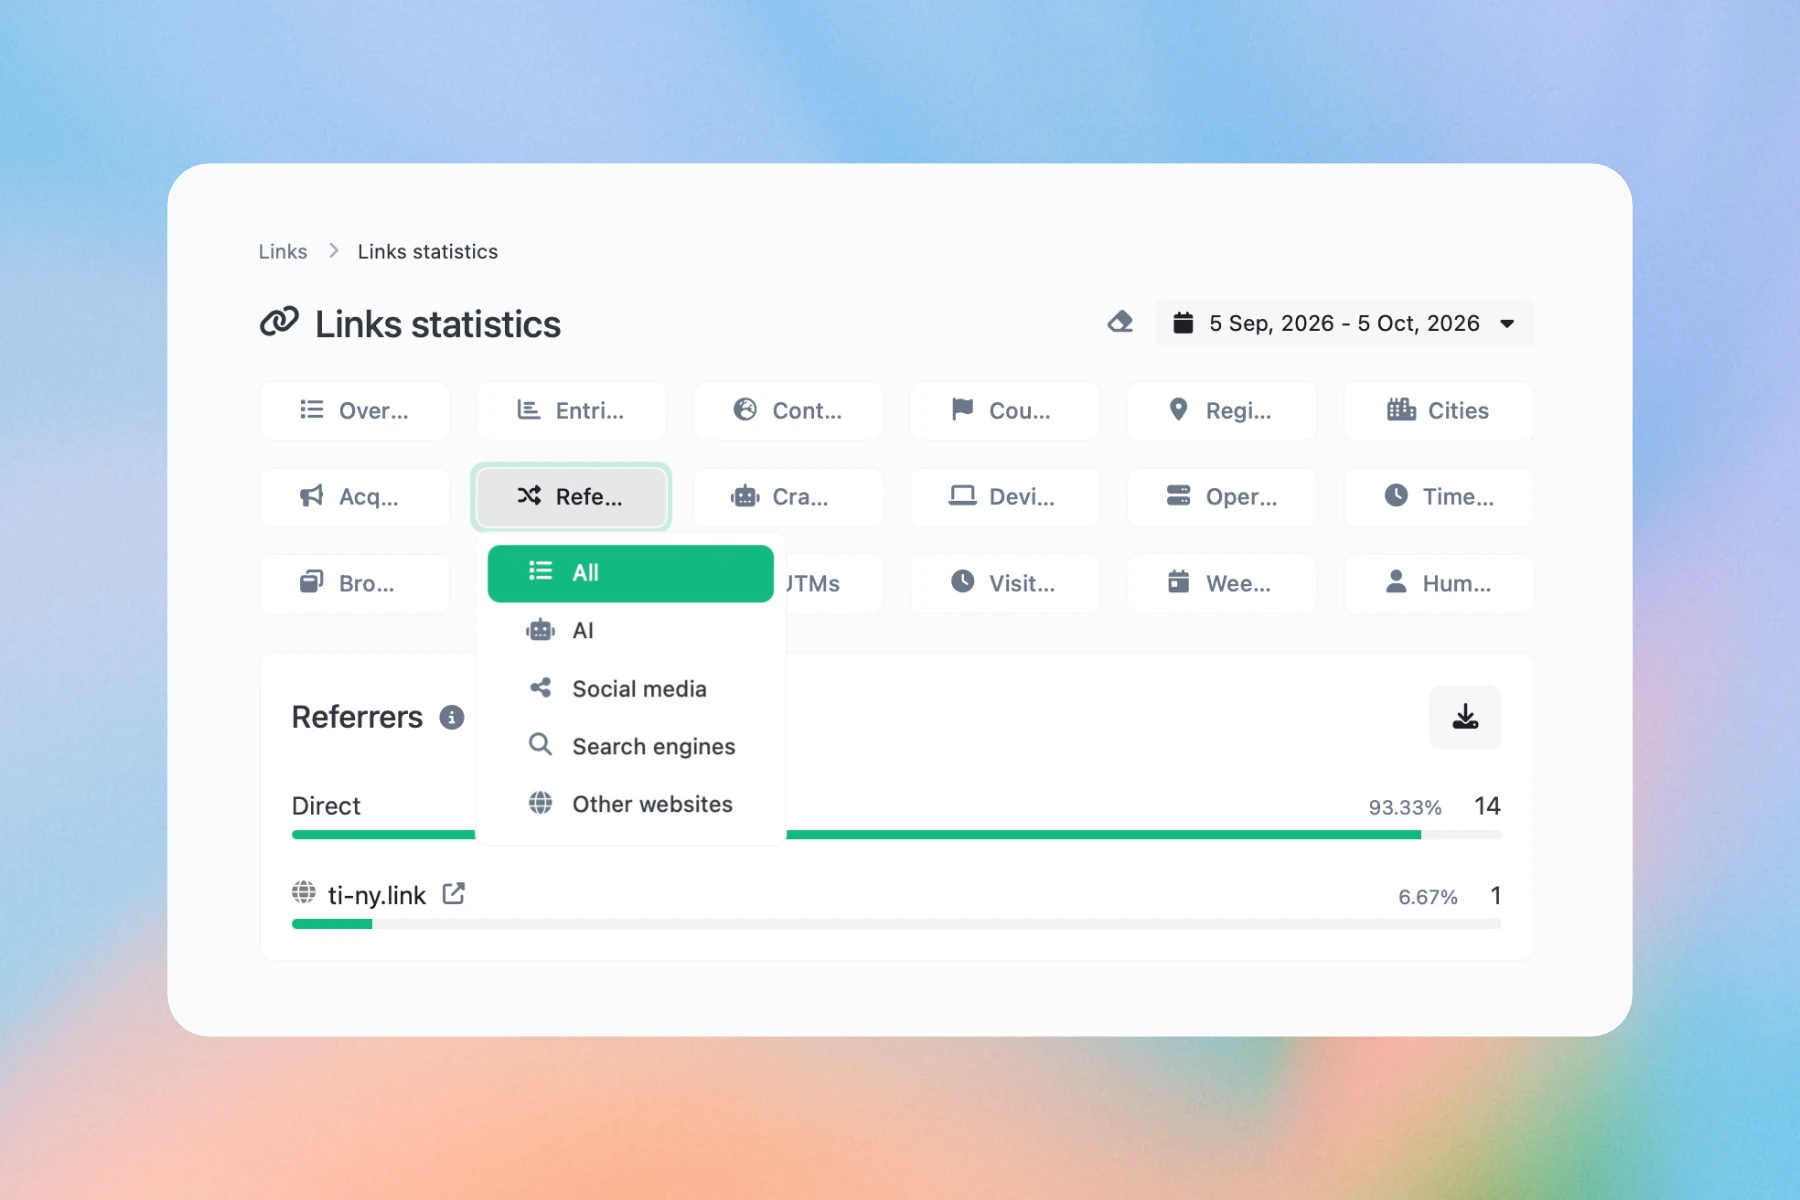
Explore the available referrer categories. This example reports 14 Direct visits and one from ti-ny.link. Use device context to improve the journey
Review the available device information and test the destination on those devices. Use your destination analytics to measure completed purchases, bookings or signups.
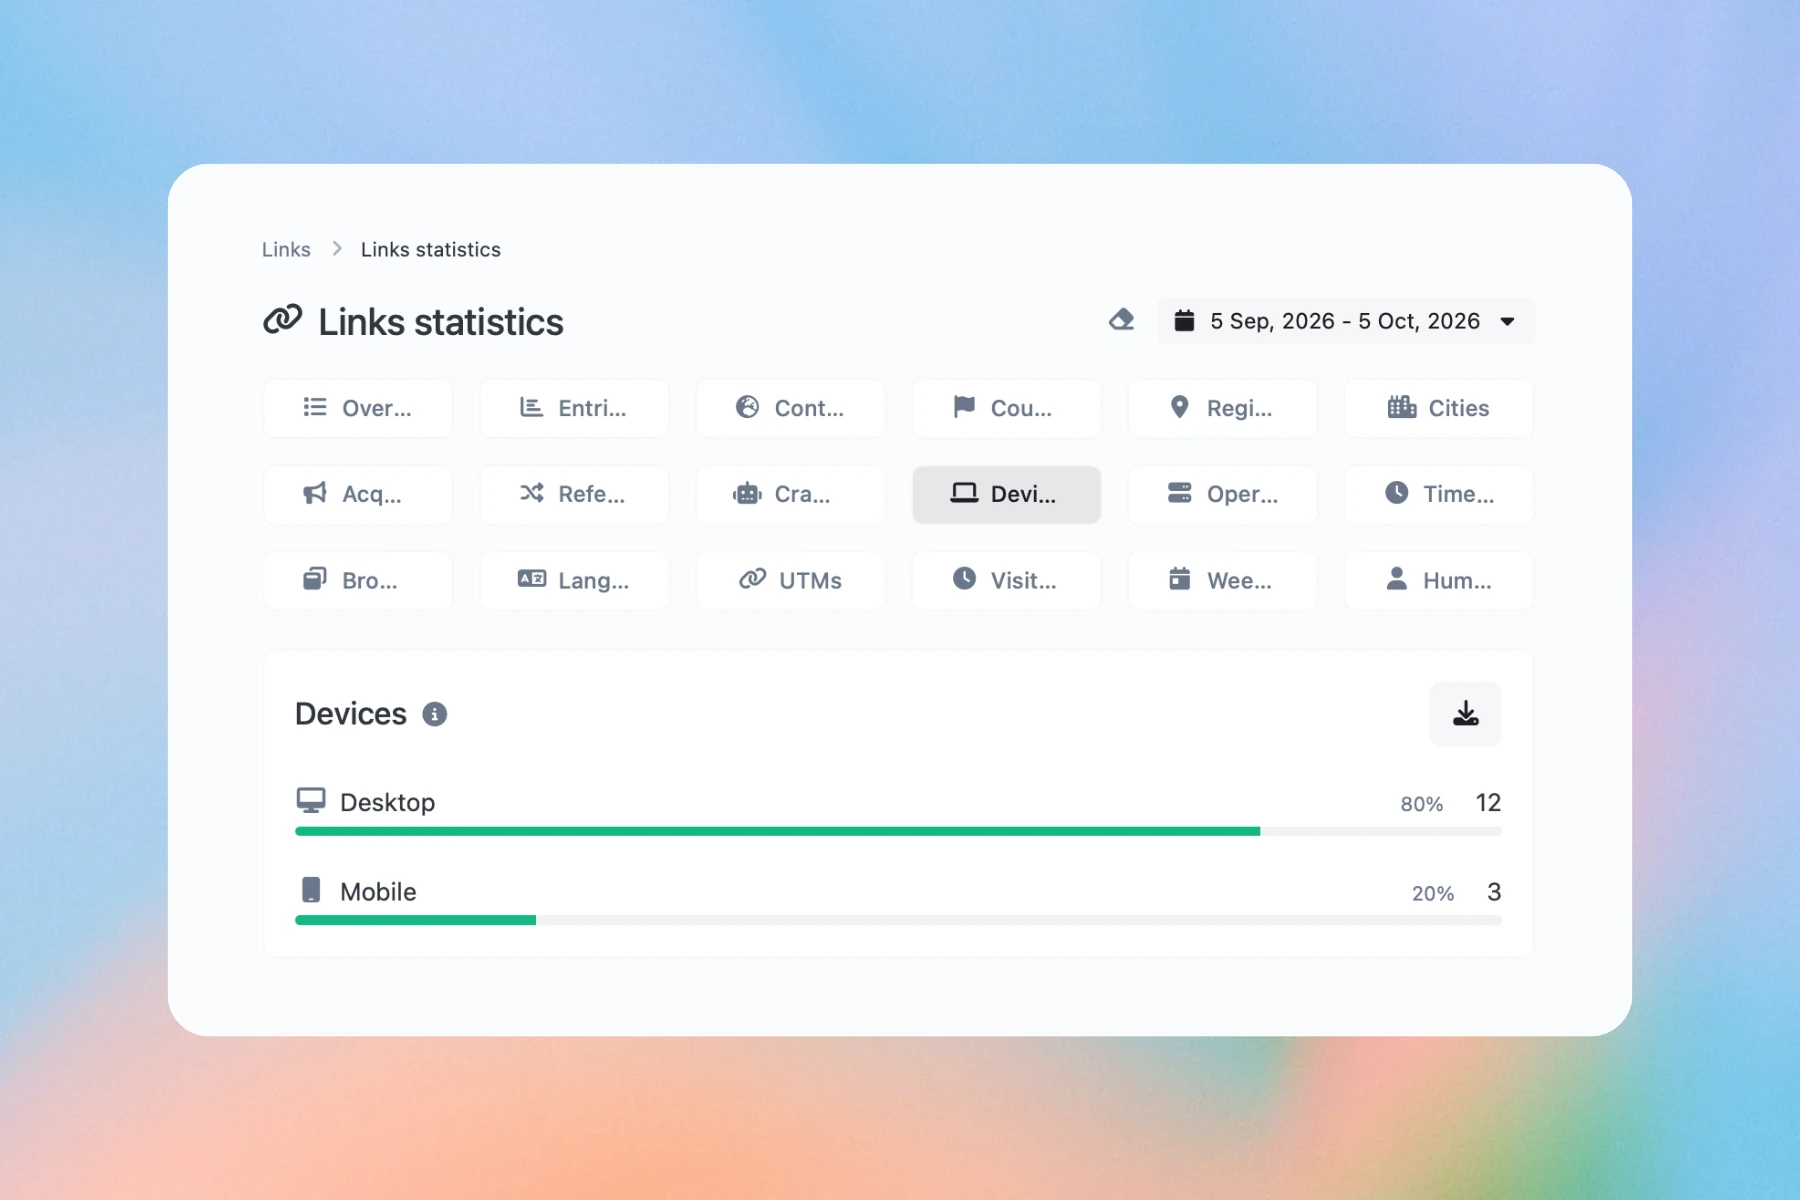
The example device report shows 80% desktop and 20% mobile activity.
The figures shown illustrate how to read the reports. Recorded visits are not guaranteed unique people, completed purchases or every camera scan. Browsers and apps can limit referral and device information.
Frequently asked questions.
Are the numbers shown here live customer results?
No. Product illustrations show example data, not live customer results. Your statistics reflect activity on your own links.
Will every visit have a referrer?
No. Referral information depends on the visitor’s browser, app and privacy settings. Direct visits and other missing sources are normal.
How much statistics history can I view?
The reporting history available to you depends on your plan. Compare the history periods on our pricing page and check the current allowance in your account. Our Privacy Policy separately explains account-data retention and deletion.
Why might a chart look empty?
Check the selected date range and the individual link’s statistics, and allow time for new visits to appear. An empty dashboard chart does not necessarily mean there has been no activity.
Put it into practice: Plan and measure a creator launch →
Get started free.
Create dynamic links, bio pages and QR codes in one place.